As the energy is essentially free, renewable electricity costs, like those of nuclear electricity, are almost entirely dependent on the up-front construction costs and the method of financing these. Minimising the initial investment, relative to the expected energy yield, is critical to commercial viability. But revenue is also dependent on when, and where, the energy can be delivered to meet the demand patterns of energy consumers.
For example, if it requires four times the capital investment in equipment to extract one megawatt hour (1 MWh) of useable electricity from sunlight, as compared to extracting it from wind, engineers need to find ways of quartering the cost of solar capture and conversion equipment; or increasing the energy converted to electricity fourfold; to make solar directly competitive.
Similarly if a technology produces electricity when consumers don’t want it; or produces it so far from the consumer that most of it is lost in transmission; then the revenue available will be proportionately less than a similar investment that better matches demand; or is located close to where it is consumed.
In most developed nations, including Australia, electricity is a traded product with the market price fluctuating from hour to hour; day to day; season to season; in five minute intervals, according to supply and demand.
Without government intervention in the market, supply and demand determines the return that is available to an investment; while the engineering solution and qualities of the resource determine the energy that a particular investment can theoretically deliver.
Before intervention, current renewable technologies, with the exception of hydro- electricity, are substantially less competitive, in terms of return on investment, than fossil fuels or nuclear electricity. It follows that wherever alternatives are in use there are other factors at play: such as the cost or practicality of a grid connection; or a government intervention in support of renewables.
In Australian electricity markets this intervention takes the form of Renewable Energy Certificates (RECs) described later. Other governments have other instruments such as cap and trade carbon reduction schemes; carbon taxes; energy buy-back schemes; and tax breaks; to achieve similar ends.
In Australia grid losses are of particular concern. Australia’s population of just over 21 million is highly concentrated in a few large cities; just eight cities accounting for over 70% of the population. The largest Sydney; Melbourne; Brisbane; Perth and Adelaide account for 63% but are separated by distances of between 670 and 3,600 km; ‘as the crow flies’. This is similar to the continental USA and a substantially greater area than the entire EEC.
Transmitting electricity over such distances results in significant losses. The market price received by a generator is therefore influenced by transmission costs and the point on the grid into which electricity generated is injected. A renewable energy project remote from the points of high demand will receive a lower price than one adjacent.
Very high voltage DC (HVDC) technology can reduce the net grid loss problem over long distances, and this is in use for links to Tasmania and South Australia, but it adds at least two costly voltage translations and the additional capital cost, together with the low capacity factor of wind and solar, precludes its use in most, if not all renewables dedicated situations.
Even with the present substantial and probably increasing REC cross-subsidies from electricity consumers, transmission factors limit the economic distance an exploitable wind or solar resource can be from the main electricity grid and electricity consumers.
Carbon Reduction Imperative
Due to improving living standards in developed and some developing countries (China India, Indonesia, Korea, Malaysia, Vietnam, Singapore etc) the worldwide demand for energy for electricity generation has been growing by around 2% pa worldwide.
Worldwide electrical energy is predominantly based on the combustion of fossil fuels (carbon and a proportion of hydrogen). The carbon is released as atmospheric carbon dioxide (CO2). The consequent exponential release of CO2is believed to be threatening the climate of the planet. This is compounded by the release of methane and other air, water and land pollution (associated with industrialisation) and the widespread disruption of the natural carbon cycle by tree clearing and broad-acre farming and grazing monocultures and damage to marine ecosystems (as a result of exponential population growth).
In response, carbon mitigation strategies are in place throughout the developed world to attempt to contain the growth of atmospheric CO2. To facilitate these strategies, renewable energy technologies are projected to make an increasing contribution to world energy consumption. The stronger these carbon mitigation strategies are; the more competitive low carbon and renewable energy becomes.
-
Hydro
-
Wind
-
Solar
-
Geothermal
-
Biomass/Biogas (including wood, algae and bio/solar)
-
Marine (tides, waves, currents)
-
Nuclear (including fusion)
Some of these involve more 'whole of life' carbon production in their manufacture; installation; maintenance; demolition; and recycling than others. The following analysis is based on the assumption that they actually run, and produce useful electricity, for their estimated lifetime. If they become ‘white elephants’ their carbon footprint becomes very large indeed.
Comparative Carbon Footprints
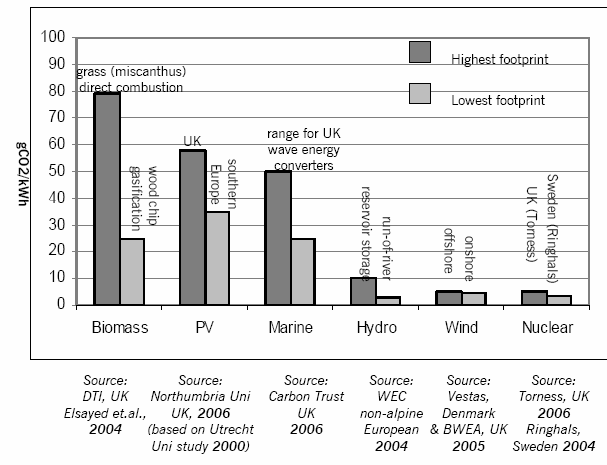
Source: UK Parliamentary Office of Science and Technology - Carbon Footprint of Electricity Generation
Projected Renewables Contribution to World Electricity Generation
The US Energy Information Administration (EIA) is the acknowledged statistical authority on world energy. The EIA estimates that renewables presently provide about 20% of world electricity consumption and projects a very significant 66% growth in renewables over the next 20 years.
At the same time rapidly rising electricity demand in the developing world (particularly China and India) is expected to require continuing growth across all energy sectors. Because of the expected rise in total electricity consumption, this translates to a relatively small increase in renewable energy’s global share. The renewables proportion of the total is expected to rise by just 1% to around 21% by 2030.
Hydro-electricity presently contributes the vast proportion (88%) of renewable energy worldwide. In the non-OECD countries, hydroelectric power is expected to be the predominant source of renewable energy growth. Strong growth in hydroelectric generation, primarily from mid to large-scale power plants, is expected in China, India, Brazil, and a number of nations in Southeast Asia, including Vietnam and Laos.
Wind the next greatest contributor, currently contributes less than 8% of the world’s renewable energy budget. But the unexploited wind resource worldwide is still vast. As a result wind generation is growing at rate in excess of 25% pa worldwide. The most substantial additions of electricity supply generated from wind power are projected in China.
The limitations on the greater utilisation of wind are economic (cost) and technical (particularly intermittency and distance to market). These limit the exploitable resource to a fraction of the total and are expected to gradually slow annual growth in wind to around 10% pa by 2030. Nevertheless this represents a tripling of wind generation over the next 20 years. On balance, wind is expected to contribute about 4% of the world’s total electricity in 20 years.
The contribution of gas is projected to grow by 63% and coal by 57% over the next 20 years. Hydro-generation is expected to grow by 41% and nuclear power is expected to grow by 39%. The only decline is expected to be small drop in the relative contribution made by liquid hydrocarbons (typically dieseline) due to expected increases in relative price.
ELECTRICITY PRODUCTION – SELECTED COUNTRIES
|
Country |
Electricity Consumption TWh |
Fossil % |
Nuclear % |
Wind % |
Hydro % |
Biofuels Other % |
Cost‡ US$/kWh |
|
Australia |
227 [2006/7] |
96.4 |
0 |
0.9 |
2.3 |
0.5 |
0.06 i |
|
NSW |
76.5[2007/8] |
94.8 |
0 |
0.2 |
4.7 |
0.3 |
0.06 i |
|
Denmark [12] |
39.3 [2007] |
82 |
0 |
18 |
0.1 |
0.1 |
0.38 r |
|
France [13] |
443.3 [2003] |
9.2 |
74.5 |
0.05 |
16.2 |
0.05 |
0.06 i |
|
Sweden |
139 [2003] |
0 |
46.4 |
0.7 |
43.6 |
9.3 |
n/a |
|
Switzerland |
58.2 [2005] |
5 |
39 |
0.1 |
56 |
0.1 |
0.09 i |
‡Source: International Energy Agency, Energy prices and taxes 2008[14]. i = industrial r = residential)
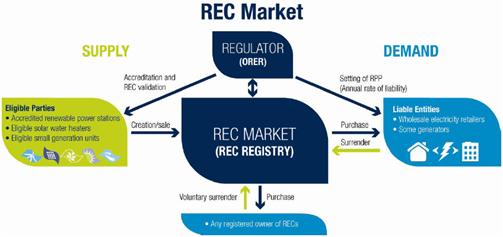
Renewable Energy Certificates
Wind and solar power is not intrinsically commercially competitive with fossil sourced energy in Australia. This is due to the very high up-front capital cost of the equipment required to capture the energy and the intermittent nature of the energy resource; so that the equipment is typically generating revenue for less than a third of the time. In addition there is a point at which peak energy delivery begins to exceed demand at different times, requiring equipment to be turned off even though the energy source is available; for example it is windy or sunny when consumers don't want the energy.
In Australia wind generated electricity, and to a lesser extent solar, is made economically viable by a system of Renewable Energy Certificates (RECs) that subsidise renewable energy producers.
RECs have been established to support the National Mandatory Renewable Energy Target (MRET) to 2030: ‘to encourage additional generation of electricity from renewable energy sources and achieve reductions in greenhouse gas emissions.’ It aims to meet a renewable energy target of 20% by 2020.
-
places a legal liability on wholesale purchasers of electricity to proportionally contribute to an additional 17,150 gigawatt hours (GWh) of renewable energy per year by 2012 increasing annually until it reaches 45,000 GWh in 2020
-
sets the framework for both the supply and demand of renewable energy certificates (RECs) via a REC market.
A REC is an electronic, tradable commodity similar to a share certificate as it represents a unit of value and may be traded for financial return. 1MWh of energy equals 1 REC. Electricity wholesalers need to buy RECs that are created by the accredited generators of electricity from renewable energy resources. Each calendar year wholesalers are required to surrender a number of registered RECs equal to their liability for the previous year; at an increasing rate (renewable power percentage (RPP)) each year.
Following a politically driven debacle that gave small rooftop solar installations a fivefold REC allowance and temporally destroyed the REC market, in February 2010, the Australian Government announced changes to the national RET scheme, separating small-scale and large-scale renewable supply. From January 2011, the scheme exists in two parts, the Small-scale Renewable Energy Scheme (SRES) and the Large-scale Renewable Energy Target (LRET). The SRES is a fixed price, unlimited-quantity scheme available only to small scale technologies such as solar water heating.
The LRET will retain the REC's existing floating price, fixed-quantity structure, and will be available only to large-scale power generation, such as wind, solar, biomass and geothermal energy. The LRET target will be 4,000 GWh less than the previous national RET scheme target, requiring the scheme to deliver 41,000 GWh of renewable energy by 2020.
The price of a REC fluctuates with supply and demand.
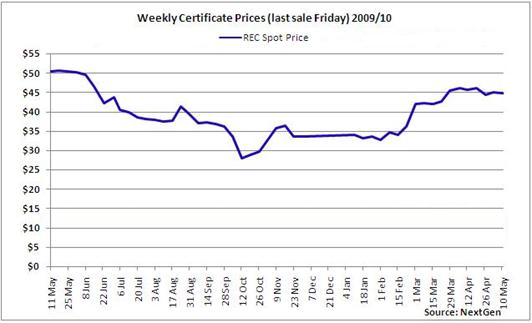
The present price means that consumers presently pay around double the mean energy price for 'renewable' wind and solar energy. This cost of subsidising each MWh of renewable energy is passed on directly to the electricity consumer in their electricity bill.
Notwithstanding the subsidy the available, the economic wind resource in NSW is too limited and too small for wind to contribute more than a few per cent to projected NSW electricity needs. Consequently NSW wholesalers buy more RECs from Tasmania and South Australia than locally, even though the power can't practically be delivered to their customers due to very significant transmission costs and losses.
As will be seen later in this paper a significant issue is that the 20% renewables by 2020 target is a politically set 'stretch goal' - like 'no child to live in poverty by...' It is extremely ambitious and very likely to be unachievable using current technology.
It is important to realise that under the REC mechanism the price will continue to rise until the mandatory targets for renewable energy are met irrespective of the technical difficulties in delivering this power. Thus if the proposed 'stretch' targets are made mandatory it is quite possible for the subsidy to make the cost of renewable energy many times that of conventional , or nuclear, energy.
Hydroelectricity
Hydro-electricity is presently the largest contributor to renewable energy worldwide; in Australia and particularly in NSW.
Hydro-electricity also is more desirable than wind generation because of a higher capacity factor and ability to produce power on demand.
But hydro-electricity is resource constrained as it is difficult to build new dams in the developed countries that are presently heavy fossil fuel consumers.
Dams flood private property and/or National parks and have many self-interested and environmentally concerned opponents. Hydro-electric schemes interfere with natural river flows and related wildlife, particularly when they involve extensive inundation. It has become politically very difficult to construct new dams in Australia, even when the potential energy resource is significant.
Nevertheless in developing countries like China, India and Vietnam there are large hydro-electricity resources that remain unexploited.
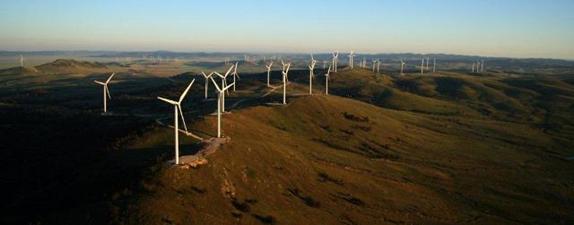
Wind
Wind is one of the oldest of man’s energy resources initially powering ships. Before the steam engine; windmills together with waterwheels were the only means of doing mechanical work that did not involve muscle power.
For example Sydney once had 19 large windmills; gradually replaced by steam engines burning wood and coal.
Wind has remained important for water pumping on rural properties; with tens of thousands of locally manufactured wind pumps still installed. Small scale electricity generation using wind-power is a widespread alternative to photovoltaic solar in rural locations where grid connection is impractical and on boats (particularly yachts).
Comet Windmills at Macksville NSW have been manufacturers of wind-pumps since 1879. Small farm, boating and local wind machines sometimes derive up to 50kW (peak) energy from the wind (typically a lot less).
By comparison industrial scale wind turbines are very large machines with peak energies typically in the MW range. Commercial wind farms typically comprise between 50 and 100 2MW wind turbines. Wind is now the most competitive renewable electricity generation technology after hydro-electricity.
Advantages of Wind Energy
When compared with all other current electricity generation technologies, wind energy has a very low carbon footprint. When large modern turbines are located in a well chosen wind province, so that the capacity factor yields a commercial return, only run-of-river, hydro-electricity and nuclear electricity produce less carbon dioxide per kilowatt hour (kWh).
Wind Technologies
The past 20 years has seen a maturing of wind technology with a move to larger, more complex wind turbines, standardising on the now familiar three blade up-wind design for its vibration free, reliability and efficient and relatively silent operation.
Until recently Denmark Germany and the US dominated wind turbine manufacture. But companies in India and China have recently entered the market by acquiring the rights to existing technology under licence or by direct acquisition. The industry is still relatively volatile with many earlier entrants, high levels of company failure and corresponding mergers and acquisitions. A few larger companies are now beginning to dominate.
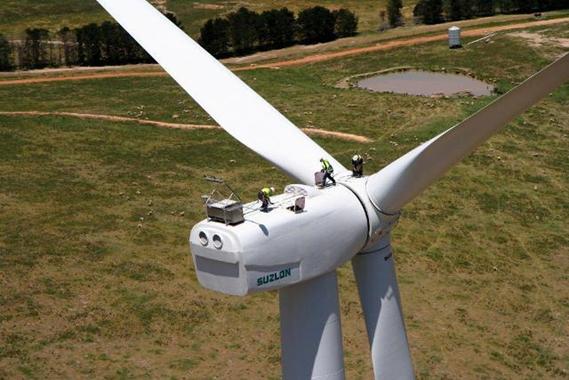
The Indian company Suzlon claims to have most of the Australian market. In the region China’s Goldwind is growing rapidly and recently acquired Germany’s Vensys.
By installed capacity (not current sales) the top ten wind turbine manufacturers two years ago were:
|
Rank |
Company |
Location |
Installed |
|
1 |
Vestas |
Denmark |
35,000 MW |
|
2 |
Enercon |
Germany |
19,000 MW |
|
3 |
Gamesa |
Spain |
16,000 MW |
|
4 |
GE Energy |
Germany / United States |
15,000 MW |
|
5 |
Siemens |
Denmark / Germany |
8,800 MW |
|
6 |
Suzlon |
India |
6,000 MW |
|
7 |
Nordex |
Germany |
5,400 MW |
|
8 |
Acciona |
Spain |
4,300 MW |
|
9 |
REpower |
Germany |
3,000 MW |
|
10 |
Goldwind |
China |
2,889 MW |
China is the world’s fastest growing wind market with over 105% growth for the last four years and projected to overtake the US (35.2GW) as the largest user this year. Australia has less than a twentieth of that installed capacity and a relatively lacklustre growth rate.
Larger machines offer economies of scale and provide better access to the wind resource Increasing the swept diameter substantially increases annual electricity output, partly because the swept area is larger (by the square of the radius) and partly because the tower height increases correspondingly; and wind speed and quality increase with distance from the ground.
But there are technical limits to this up-scaling, including materials technology, centrifugal forces and aerodynamics. The blade must be very strong and relatively light. Blades are typically made from glass reinforced plastic (GRP) and incorporate lightning protection measures. The maximum tip speed of a turbine blade is limited by turbulence and noise to around 300 km/hr (and ultimately by the speed of sound, about four times this speed).
The 2.1 MW machines at Capital Wind Farm recently completed in NSW are close to the present commercially optimum size (with blades 41 to 45 metres long rotating at 17.7 RPM; a tip speed of 300 km/hr). The turbine is supported on an 80m tall steel tower 4.3m in diameter at the base, tapering to 2.3m at the top.
Source: Capitol Wind Farm Publicity Shot
Although machines over three times larger are in operation they do not appear to offer substantial commercial advantage (through a cost reduction per MWh generated[18]).
Advances in electronic monitoring and controls, blade design, mechanical and electrical design have also contributed to a drop in the capital cost per kWh of electricity generated. Capital Wind Farm averaged AUD$3.13 million per 2.1 MW wind turbine installed. The Indian turbine manufacturer Suzlon Energy Limited was the turnkey contractor responsible for the Engineering, Procurement & Construction (EPC) of the entire project as well as ongoing service and maintenance of the wind farm.
This comprised[19]:
Design and manufacture of the wind turbines;
Detailed in-house wind turbine micro-siting;
Grid dynamic studies;
Design, construction and maintenance of more than 30km of new access roads;
Design and construction of footings and hardstands for each tower;
Design, fabrication and installation of steel turbine towers;
Shipping, installation and commissioning of the turbines;
Design and installation of electrical feeder systems both below and above ground;
Linking the turbines to the substation;
Design and installation of a new 330kV substation, including two 330/33kV transformers;
240km of high tension cables for rock-anchor footings;
11,300T of steel for towers;
60km of underground cable;
10km of overhead cable.
Large wind generators have a projected working life of 20 years but require ongoing maintenance. Towers and blades are subjected to continuous flexing and vibration, in turn transmitted to bearings and the gearbox. Recently Suzlon have had to replace a number of blades overseas after only a few years operation due to inadequate manufacturing or design specifications. Electrical equipment and electronic controls may also require regular maintenance and replacement.
By comparison wind turbines are higher maintenance than hydro generators but relatively low maintenance compared to gas turbines; or coal plant; and most solar thermal plant designs; with a similar generating capacity.
Larger wind farms (clustering many machines) are more economical than smaller ones due to transaction costs, operations and maintenance costs that can be spread over more kilowatt-hours with a larger project. The American Wind Energy Association attributes cost savings of up to 40% for a project of 51MW (like the Capital Wind Farm), compared to a small farm of one or two machines[20].
There is considerable mechanical and electrical technology associated with a large modern wind turbine. Wind changes speed and direction. Like all other horizontal axis machines the whole nacelle needs to turn on the tower (yaw) to face the wind; requiring an additional drive subsystem. The turbine needs to be slowed or stopped to allow any substantial change of direction or serious damage to the structure is likely to result from twisting due to angular momentum (the gyroscopic effect).
The wind energy depends on air speed and mass (density). Both of these vary; air density declines with both increasing air temperature and increasing humidity[21]. Dust and rain also alter blade aerodynamic performance. Modern machines can be made to extract more wind energy from a given resource by adjusting the blade pitch to an optimum for the prevailing temperature, humidity and wind speed.
In large AC machines used to supply power to the grid, the rotational speed of the alternator is very close to constant while connected, the alternator being synchronised to the frequency of the grid. Any attempt to drive the shaft faster results in an advancing waveform and additional energy being absorbed by the grid. This correspondingly increases the current generated by the alternator (the voltage remaining constant).
A gear box between the turbine hub and the alternator holds the operational rotation of the turbine blades in constant relationship to that of the alternator. As indicated above in large machines this is dictated by the practical tip speed of the turbine blade. As a typical three phase 50 cycle alternator has a rotational speed of 1500 rpm a gearbox is required to increase (in this case) 17.7 rpm to 1500 rpm. This can’t be done in a single step so a multistage gearbox capable of handling the turbine’s peak power (>3,000 horsepower) is required.
The Suzlon S88, used in the Capital Wind Farm, has a three stage gearbox (one planetary stage & two helical). These gearboxes and associated bearings are amongst the largest manufactured today. All gearboxes have a small efficiency loss of around 1% per stage and this loss appears as heat. 3% of 2MW is around 60kW (30 electric room heaters at full blast) and this needs to be dissipated through an oil cooler and additional equipment in hot climates.
A transformer in each structure converts the ~690V AC @ 50 Hz generated by each turbine to 33kV AC for transmission to the grid (in NSW). As each turbine gains initial operational speed it needs to be locked into phase with the grid before its power can be delivered, typically using thyristor (solid state electronic) cut-in. Once it is powered up the thyristors are typically bypassed to save losses. When wind speed is low the alternator, if still electrically connected, will act as a motor and attempt to drive the blades (a giant fan) consuming power from the grid. Thyristor controls disconnect the alternator in these conditions (and the blade rotation may be stopped using a brake).
In high wind the turbine power can potentially rise until the alternator or drive train exceeds its rated maximum power. Prior to this point the turbine must be shutdown. If, during high wind the alternator exceeds its ability to absorb the power and fails; or if it is suddenly disconnected from the load (for example if the grid transmission line breakers trip when hit by lightening); or the drive train breaks; the turbine rotation will rapidly accelerate (runaway), with exponentially growing total energy.
One or more of these faults may cause the alternator or other components to catch fire. The energy and torque developed in a runaway turbine quickly exceeds the capability of the main shaft to stop it even if the mechanical brake could stop the shaft rotation. If allowed to continue the whole machine will be destroyed catastrophically (due to a blade or bearing failure; leading to an out-of-balance condition; nacelle detachment; blade contact with the tower; and/or tower failure).
|
A spectacular runaway and deconstruction; there are related links to images of wind turbines on fire All large wind turbines have multiple safety devices to prevent such a runaway failure. |
Some turbines have electrically or hydraulically driven tip brakes to stop the rotation in high wind, in others the equipment used to set the pitch of the blades is used to stop the turbine by feathering the blades. All large machines have at least one mechanical brake and brakes are held open by the proper functioning of the machine so that they ‘fail-safe’. Wind speed, direction and air density are continuously monitored at each machine. Any mismatch between the machine performance and the wind measurements immediately triggers the fail-safe equipment.
Like fluky wind that changes direction, gusty wind that repeatedly pushes a turbine over its rated wind speed limit will cause frequent shutdowns and restarts, seriously impacting the capacity factor.
There are alternatives to the now ‘run of the mill’ 2MW AC design. For example the very large Enercon machines use an annular low-speed synchronous generator that requires no gearbox. The turbine speed is allowed to vary to match wind conditions using variable pitch control on the blades. The output voltage and frequency vary with wind speed and are first rectified to DC then inverted for output to the grid.
Elaborate solid state power electronics and control substitute for the mechanical systems of the more typical AC design. Other manufacturers have alternative alternator configurations including those with dual windings that allow multiple turbine speeds for different wind conditions.
All of these control systems need to be automated using computer technology and to be remotely connected to a central control system. The design of these systems and the related control software is fundamental to the efficiency and safety of the machine and the resulting capacity factor. It is the closely guarded intellectual property of each manufacturer.
In addition to the conventional upwind three blade turbine used commercially, there is a vast array of alternative turbine designs, including vertical designs that operate independently of wind direction. These are commonplace in the ‘small farm generator’ and ‘battery charging’ market and there are many speculative designs that involve scaled-up versions. With the exception of two blade designs, to date, none of these alternative turbine designs has been taken up commercially by large wind farms for significant supply to the power grid.
Disadvantages of Wind
- The availability of practical sites, with good quality wind resources, within an economic distance of electricity demand (transmission costs).
- The relatively high cost per kWh, compared to conventional energy sources.
- Its unpredictable, intermittent nature and the high cost of electricity storage.
The economic viability of wind power drops quickly as the quality of the wind resource declines. Most new well placed wind farms achieve a capacity factor of over 30% and this provides a good commercial return at about twice the thermal energy cost. But some older farms do not achieve 20%. Denmark, the largest (by proportion) exploiter of wind in the world and leader in wind technology, achieved a global capacity factor of 26.2% in 2007[16]. Several sources state that the average capacity factor of wind in Germany in 2003 was only 15% and that the average capacity factor in the UK was 24% despite some very high rating wind farms in Scotland and off-shore[17].
Many EEC countries implemented cap-and-trade market mechanisms and other incentives for renewable energy and were early wind adopters, with Germany having the largest installed capacity in the world until 2007 (on the basis of carbon cap-and-trade and feed-in tariff incentives). It is evident that in the rush to ‘make a euro’ off the back of these schemes, many locations were ill chosen. In addition earlier turbines were less efficient at exploiting poor wind conditions. This gave incentive for German firms to lead the technological improvements now evident and, as will be seen later, for their becoming acquisition targets for the new wind ‘super powers’: India and China.
A similar situation prevailed in respect of solar energy incentives with Germany a huge early adopter of initially technically unproven technologies.
Various attempts at energy storage to smooth out fluctuations in the wind have been suggested including batteries and hot salt (as used by large thermal solar plant) but these add so much to the capital cost that wind producers prefer to suffer the possibility that energy markets will not accept their production when consumer demand is low and wind is strong.
This, in effect, sets a top limit on the proportion of wind power that it is economic to attach to a grid. This limit is discussed later. Like solar, wind power (without storage) is dependent on other generators to meet the consumer demand when there is no wind (or sun).
The Australian Wind Experience – An Example
In NSW good wind provinces wind are not as plentiful as in the South and wind presently provides less than 0.2% of the State’s electricity.
There are now ten wind generators in NSW having a combined capacity of 149MW (0.15 GW). A further 33 (2.9 GW) are proposed. Total installed wind capacity within the National Energy Market (NEM, encompassing the Eastern states and SA) is presently 1.7 GW, with a further 650 MW is under construction.
The largest wind farm in NSW is the Capital Wind Farm near Bungendore that comprises 67 2.1MW wind turbines[15] with a total installed capacity of 140.7 MW and an annual (projected) production of 450,000 MWh/yr.
A wind farm is a substantial commercial undertaking. The publicly announced cost of the Capital Wind Farm project was $210 million. This scale of undertaking requires an assurance of a sound return to investors.
The location of a wind farm and proper initial mapping of the wind resource and subsequent micrositing of each turbine is critical to achieving an economic energy cost and justifying the claimed environmental credentials of wind (a low carbon footprint).
The economics and capacity factor are very sensitive to the quality of the wind resource. This needs to be as constant as possible and not fluky. Uninhabited ridge linesare usually preferred. For example the Capital Wind Farm is anticipating 450,000 MWh/yr (from 140.7 MW installed); a very optimistic 36.5% capacity factor.
Source: Capitol Wind Farm Publicity Shot
The Capital Wind Farm site covers more than 35 square km on the Hammonds, Ellenden and Groses Hill ridgelines 60km North East of Canberra. The owner is Renewable Power Ventures Pty Ltd - a subsidiary of Infigen Energy Ltd.
For reasons of transmission line cost and grid losses under the present value of RECs, the practical maximum distance of a wind farm from the present NSW 330kV grid is limited to few tens of kilometres. As solar electricity is presently more expensive to collect, the economics of large scale solar are even more adversely affected by distance to the grid.
For example, Capital Wind Farm connects to the grid via a 10 km long 33kV transmission line. This is stepped up to 330kV at the grid connecting sub-station. Nevertheless transmission infrastructure contributed significantly to the cost of the project.
As already indicated in the introduction wind and solar energy costs are very dependent on the total up-front construction costs and the method of financing these. Minimising the initial investment relative to the expected energy yield is critical to commercial viability. But revenue is dependent on energy delivered and as indicated above the pre-REC, NEM price is influenced by transmission costs and the point on the grid into which electricity generated is injected.
Even with the present substantial and probably increasing REC cross-subsidies from electricity consumers, transmission factors limit the economic distance an exploitable wind or solar resource can be from the main electricity grid and electricity consumers.
Many of the remaining wind resources that combine: a good wind province; proximity to the grid and electricity markets; and a sufficiently large precinct for an economic grouping; are not presently available for property access, planning or environmental reasons. There is also a growing, largely rural, anti-wind protest movement, both in Australia and overseas.
The intermittent nature of wind power requires transmission capacity to handle its maximum output. This requires a plant around three to five times larger than is justified by the average load. The up-front cost of a long transmission line adds significantly to the resulting net energy cost. There remain very good, continuous but remote wind provinces in the South of the continent that might support a very large wind farm, combined with limited storage and fast open cycle gas generation to smooth wind fluctuations and HVDC transmission back to the grid. But it is unlikely that any wind farm in NSW would justify the additional capital cost involved.
Wind is seldom a good match for the customers’ consumption requirements. These fluctuate significantly but in a predictable way. Denmark has found that at about 20% wind (average contribution) there are periods when the peak energy available exceeds the customer demands. Although they are attached to the European grid and can export these peaks, the price received is likely to be zero. These large fluctuations also have serious grid stability and management implications. They are particularly adverse for remote communities with insufficient facility to dispose of generation peaks at times of low demand or draw on other resources when demand is high.
Danish wind power capacity and wind power's
share of domestic electricity supply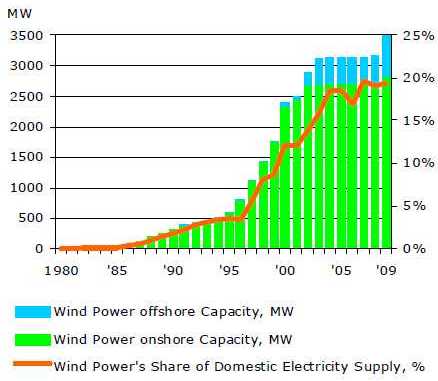 Source: Energy Statistics 2009 - Danish Energy Agency pp 9
In Eastern Australia the AEMO will cut wind farms off the grid when power generated exceeds the capacity of consumers to accept it. If, with more entrants, farms are increasingly unable to sell power at times of optimum wind, the commercial viability of additional (and existing) wind capacity will be seriously degraded. When turbines are turned off for long periods the benefits of carbon saving are lost as stationary wind turbines have an infinitely large carbon footprint. The carbon expenditure per kWh then exceeds that of coal.
South Australian and Tasmanian farms are approaching this limit, and are already selling peak electricity into Victoria. SA currently has just over 1,000 MW of installed wind capacity to which needs to be added a minimum base load from conventional power stations.
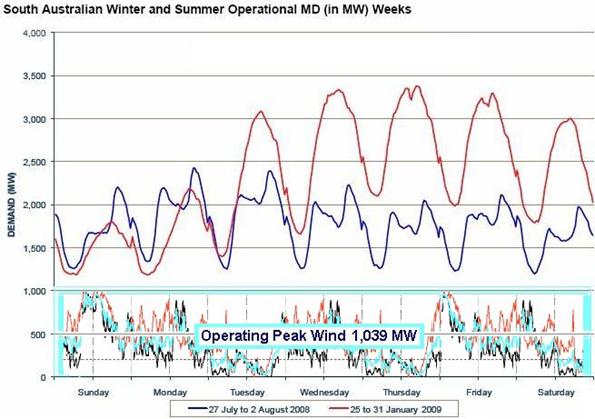
Source: AEMO – and a typical daily wind pattern measured from multiple farms 70km apart– indicative only
In addition, there are 30 wind proposals in SA totalling up to an additional 3,000 MW, including a $1.0 billion 600MW (300 turbine) farm located between Beachport and Mt Benson. If most of these eventuate, the lower production curves in the above diagram will expand vertically to completely overlap the demand curve and SA will have peak wind capacity well in excess of the local ability to consume the power available (even at peak summer demand) during optimum wind conditions. As a consequence a large number of turbines will need to be shut down as the wind energy rises. The overall wind capacity factor in SA will then fall steeply (and the carbon footprint of the wind turbines will rise).
At the same time SA must maintain conventional capacity sufficient to cover periods when wind is not blowing. These factors will both limit the further deployment of wind power in SA and require additional infrastructure to import and export electricity to Victoria and the NEM. This inevitably involves significant energy losses, additional electricity production and higher electricity prices across the NEM.
It is partly for distribution reasons that the adoption of wind power has been relatively slow in Australia. Wind presently contributes 0.9% of Australia’s electricity and if all the presently projected developments eventuate, this will just double. It remains to be seen what future projects the projected escalation in the price of REC’s and an ETS will encourage.
For example if the REC price is forced up significantly by a shortfall in economic renewable resources, the owners of existing wind farms will make very substantial ‘windfall profits’ (for no effort on their behalf) while at the same time very little additional renewable energy will result (due to the very conditions that forced the price up).
Thus there will be pressure to devalue the REC (as happened for rooftop solar), for example by offering additional RECs for transmission infrastructure or to relax the mandatory targets in favour of voluntary targets.
Again the total cost would be borne not by the companies involved (that may be very profitable) but by the electricity consumer.
Solar
The overwhelming advantage of solar is that the energy resource is well in excess of any other renewable or fossil fuel and the source energy is close to limitless.
The practical limitation is that the cost of capturing the energy and transporting it in a useful form (as electricity or perhaps hydrogen) is many times higher than that of already available energy resources.
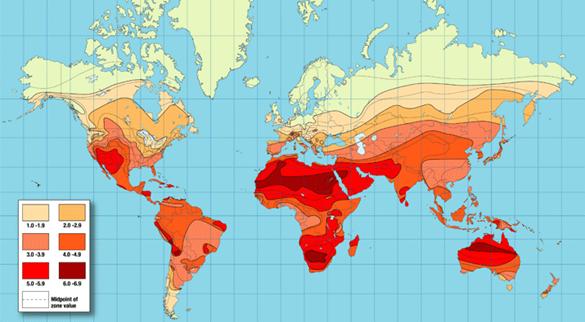
Terrestrial solar suffers from an inherently lower capacity factor than a good wind province (17-30 solar: 20-35 wind) and is also affected by macro-location issues due to clouds; hours in the day; horizon and shading issues. Atmospheric absorption (air mass) falls with altitude but rises with the angle of the sun below the zenith (directly overhead). Outside the tropics air mass absorption is strongly affected by latitude, particularly when the sun is low in the sky early and late in the day.
Thus the desert areas of Australia, India and Africa and South America (particularly at higher altitudes) are optimum solar provinces. A good deal of the US has excellent solar incidence.
Solar suffers similar intermittency issues to wind. In many urban (non-desert) areas cloud cover and rain seriously reduces the capacity factor and of course the solar capacity factor is seasonal, particularly outside the tropics.
Except for air conditioning, solar energy is not available when it is most needed by consumers (in winter and at night) and too intermittent, without storage, for use by industry. Thus an additional storage cost needs to be factored in and for solar, often the cost of additional long distance electricity transmission from desert or high altitude provinces.
Photovoltaic (PV) solar is already widely used ‘off grid’ for small and emergency power supply and feed-in applications. The main advantage of PV solar is, relatively maintenance free and reliable, direct electricity generation; suitable for charging batteries.
Extracting about four times the energy from a given area of PV solar panel without increasing the cost; reducing the cost fourfold; or combining solar at low cost with another purpose (like incorporating solar collection into windows, roofing materials and/or wall panels) could make PV solar price competitive with current generation wind technology.
In Australia marginal solar will become progressively more attractive to large scale generators if/when the value of a REC (or equivalent ETS) rises above $200.
It seems evident from the literature that researchers are more confident that the cost of PV Solar (based on the cost of electronic technology) is more amenable to future cost reductions than either wind or thermal solar.
For example: modern cadmium telluride (CdTe) thin film photovoltaic (PV) solar cells presently cost about US$110/m2 and can produce around 100 to 150 watts per m2. Higher efficiencies[23] have been achieved in the laboratory (up to 20%). This would increase the energy collected over each square metre. Production improvements and higher volumes might lower the pre installation panel cost to say $0.50 per square metre. To this needs to be added the cost of installation, support-structures cabling and so on; but intelligent building design might incorporate these into roofs or walls. In a ‘real-world’ environment, with a good solar incidence (low latitude/high altitude) and capacity factor (low shading /low cloud environment), it is hoped that a cost per kWh of 8 US cents can be achieved within a decade. At this point PV Solar may become price competitive with current large scale (optimised) wind[24].
The main competing PV technology is the more mature crystalline silicone. In general this is presently less amenable to further cost reduction but mono-crystalline silicon designs may be able to achieve equal or higher efficiency.
In the large scale renewable sector wind has presently substantially outstripped solar due to lower capital cost per kWh delivered but anticipating higher value RECs some wind projects propose a PV solar co-generation installation. This may serve to better smooth fluctuations in either supply and better utilise transmission infrastructure.
Apart from PV solar there are numerous thermal solar designs. These typically use mirrors or occasionally lenses to focus the sun’s energy onto an energy absorbing element. This may be located on a tower or directly in front of a parabolic mirror. The absorbing medium (high temperature liquid and/or gas) then transfers heat to an engine that drives a generator or performs an energy absorbing chemical separation.
There are fundamental thermodynamic laws that constrain the efficiency of these processes and require very large collection areas in proportion to the solar incidence (insolation). These in turn tend to result in very high capital costs. As with PV solar development work is directed towards improving energy capture per square metre of collector (efficiency) and reducing the cost per square meter of collector. At this stage thermal solar is relatively mature with over 100 years of development but no breakthrough has yet overcome these cost hurdles.
For example, the first solar power station in Australia was commissioned in 1979 at White Cliffs NSW. White Cliffs is in the far North West of the State, adjacent to SA and Qld and was chosen because it has the highest insolation in the State. It consisted of fourteen three-metre parabolic dishes focussed on a collector, where water was boiled to drive a steam engine, delivering up to 25kWe and complimenting the town’s diesel generator. The town was connected to the grid in 1996. At this point the station was converted to experimental photovoltaic (used as grid feed-in). It ceased operation in 2004.
The largest commercial solar power station in Europe is the Andasol parabolic trough solar thermal power plant in Granada, Spain. Andasol 2 went online in March 2009. Andasol 3 is currently under construction. Because of the high altitude (1,100 m) and the desert climate, the site has exceptionally high annual direct insolation of 2,200 kWh/m² (7,920 MJ/m²) per year. Each Andasol plant has a gross electricity output of 50 megawatts (MWe), producing around 180,000 MWh per year. Each collector has a surface of 51 hectares; occupying about 200 ha of land.
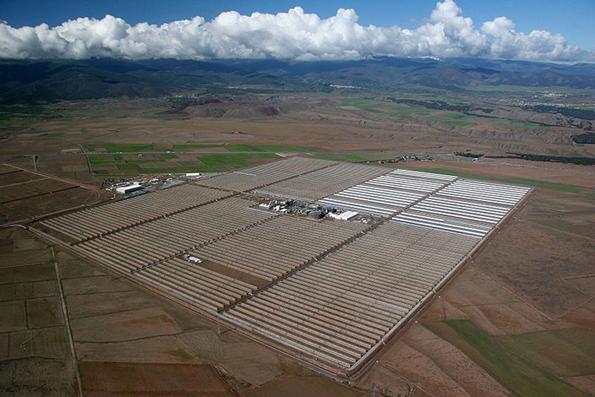
Source: Andasol Publicity Shot
Solar plant is considerably more physically compact than wind; compare Andasol with the Capital Wind Farm generating 450,000 MWh per year over a total site of 35 square km (but less equipment overall).
Each unit has a molten salt[25] thermal storage system which absorbs surplus heat produced at midday. A full thermal reservoir (in summer) can continue to run the turbine for about 7.5 hours at full-load after sunset. Energy storage improves the capacity factor of the Andasol facility to a claimed 41%, with a considerably less fluctuating power curve than non-storage configurations. Each Andasol plant cost approximately AUS$500M ($10,000/kW) and the commercial viability is said to depend on a huge subsidy; equivalent to between $400 and $600/MWh[26] (in Australia equivalent to a REC + ETS price of $400 to $500).
By comparison a 2,000 kW wind turbine costs around one seventh of this per rated kW. The Capital Wind Farm cost approximately $210 million ($3.1 million per turbine installed; $1,493/kW capacity). After adjusting for its improved capacity factor, due to thermal storage (but not taking into account differences in maintenance or capital servicing), Andasol solar power is around six times the delivered price of electricity from the Capital Wind Farm.
In Australia an advanced solar thermal pilot plant under construction at Newcastle is based on 450 collecting mirrors (4000 m2) together with a 30 m high tower and associated heat engine (turbine and generator). The projected output is 200 kW at a (pilot) cost of $5 million ($25,000/kW – two and a half times that of Andasol).
In NSW similar cloud free solar provinces to Andasol are many times more distant from the grid than proven wind resources. White Cliffs is the only town in NSW with similar insolation; but there are less remote areas of Australia (in Qld, SA, and WA) that are similar or better solar provinces. These may well become economic before any in NSW.
Together these factors that suggest it will be a considerable time before large scale thermal solar becomes competitive with wind in NSW; even with a REC price rising (in combination with an ETS) to provide a subsidy comparable to that supporting Andasol.
Biomass
Biomass is already widely exploited in Australia with over 30 generators (as large as 63MW) in Qld and five in NSW consuming sugarcane bagasse. Co-firing in thermal stations has also been applied on a limited basis. Installed biomass capacity has been surpassed by wind power because the present biomass resource is limited to agricultural by-product and hardwood woodchip.
In the Bayswater B Submissions Report - AECOM states:
The inclusion of biomass co-firing is an option for thermal plant. It increases the capital costs and degrades plant performance. Macquarie Generation has been active in the utilisation of biomass firing to replace coal. The quantity of saw mill residue and vegetable oil co-fired at Bayswater and Liddell was less than 1% by mass due to limited supplies of biomass and plant performance issues. Furthermore biomass had to be sourced from distances up to 300 km incurring prohibitive transport costs. An additional concern is the use of diesel fuel consumed with associated GHG emissions for the transport of the biomass.
Macquarie Generation does not currently fire biomass at Bayswater and Liddell due to the impact the low energy fuel has on plant output and the high cost of transport and handling which makes it uneconomic. The lack of available locally sourced biomass and its high cost make biomass co-firing presently non-viable. It is also understood that the future availability of sawmill waste is threatened as a result of the declining native timber hardwood industry.
The specific energies of softwoods are significantly lower resulting in little if any useful heat release.
A related, emerging technology, might be called bio-solar. This employs genetically modified algae or other biological organisms to absorb solar energy to convert CO2to hydrocarbons for fuel (or plastic and other organic chemistry manufacture). This technology has potential to reduce electricity demand by displacing electricity in a number of industrial and transport processes.
Marine
Wave and tidal power pilot plants have been very costly to build per kW and in the case of wave power have often suffered very high ongoing maintenance costs. This makes the average carbon footprint of current marine (tidal and wave) power nearly 100 times larger than that of wind, with very much higher delivered energy costs.
Geothermal
Geothermal power is competitive with coal and less expensive than wind when the resource is very near to the surface; for example in the ‘pacific rim of fire’ countries. Many plants already exist around the world in volcanic areas. Unlike wind or solar geothermal power is continuous and ‘base load’. But the easily exploited resource is geographically limited and its contribution to total energy consumed worldwide is negligible compared to that of hydro and wind.
Deep geothermal is more widely distributed and is being explored in several locations in Australia but at the present time substantial technical issues have not been fully resolved and the capital cost of extraction is likely to be very high (leading to a high carbon footprint and very high cost per kWh).
Nevertheless it is hoped that geothermal power could compliment wind or solar as the REC value climbs and/or an ETS comes into effect.
Nuclear Electricity
Nuclear power is a significant competitor to renewables generated electricity in many countries. Conventional nuclear power (fission) is growing rapidly and fusion sill holds promise for the future (as the resource is effectively limitless).
In much of the world nuclear generated electricity is already competitive with fossil fuels and less costly than wind or solar energy. Nuclear energy is expected to replace a modest proportion of fossil fuel generated electricity in many large economies during the first half of this century[28]. Prominent amongst these are China and India[29].
For example, the Republic of (South) Korea produced 343 TWh of electricity in 2004[30] of which 63 per cent came from conventional thermal sources, mainly coal, 36 per cent came from nuclear power, and a small amount came from hydro-power stations. But nuclear power is planned to steadily increase its share of the country’s net electricity generation. Korea already has four operating nuclear power stations containing a total of 20 nuclear reactors with a total capacity of 17,716 MWe. This exceeds the total electricity generation capacity in NSW[31].
Six additional reactors are under construction and a further six scheduled for completion by 2021 (total 14,800 MWe capacity). As a result, Korean manufacturers have developed proprietary IP and are beginning to market reactors internationally (with a target of 80 reactors exported by 2030)[32]. Similarly another major NSW coal customer Taiwan has two new 1,350 MWe reactors due to come on line this year.
A carbon mitigation strategy that attempts to achieve a zero increase in CO2emissions worldwide by 2030 (while not constraining economic growth) would need to achieve a very much faster growth in renewables than is presently the case (or is achievable in practice).
Implicit in the EIA projected worldwide growth in coal and gas consumption is the assumption that many new thermal power stations will be built. Many existing thermal power stations worldwide will also need replacement in this time frame.
Worldwide, the only practical and available alternative in a 20 year time-frame may be a very much faster growth in nuclear energy. If reliable, proven designs are adopted, allowing approvals to be streamlined, nuclear stations could have similar lead times to thermal stations.
A relatively modest threefold increase in present nuclear generation worldwide would meet the entire projected world electricity growth to 2030 and together with projected growth in renewables, return World fossil fuel consumption for electricity generation to 2006 levels.
World Electricity Projections to 2030 Present and with 300% Nuclear
Source: IEA ibid; and the author
Simply replacing conventional thermal stations with nuclear stations as they retire may obviate the need to use the marginal renewables such as wind and solar when they are uneconomic without subsidy.
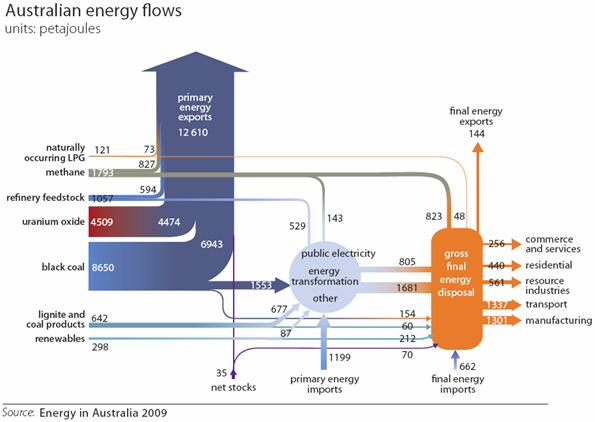
The dominance of coal and uranium are immediately apparent, as is the very small contribution presently made by renewables. The total of the carbon in the coal, gas and oil represents the Australian contribution to worldwide CO2 emissions.
The domesticity consumed component of this is so small that the domestic achievement of 20% renewables would be overwhelmed by a fractional increase in coal exports, as a result of the growing world demand for coal-fired thermal electricity.
A cessation of Australian coal exports might make a greater contribution to reduced world CO2 release. This would result in an increase in the world coal price, followed by accelerated development of coal projects in other countries to meet the growing demand.
This may be marginally effective as a higher coal price could be expected to accelerate the adoption of nuclear power, particularly by major NSW coal customers[33]; all of which have a high and growing nuclear capacity. But such a policy would have a serious short to medium term impact on the Australian economy (particularly in NSW[34] and Qld). Correspondingly, a relatively small increase in the export of uranium oxide would achieve greater reduction worldwide carbon emissions than can be achieved by adopting renewables domestically.
Footnotes:
[12] Denmark is has the largest proportion of wind generation in the world. It is also has the greatest fossil dependency (mainly on imported coal) and highest cost electricity in the EU, over seven times that in France.
[13] France produced 536.9 TWh of electricity in 2003; is the largest net exporter of electricity in the EU (103.6 TWh in 2003); and has the highest proportion of nuclear electricity in the World.
[14] http://www.iea.org/textbase/nppdf/free/2008/key_stats_2008.pdf Energy in Australia 2009 ibid; note that currency fluctuations and varying time-of-day tariffs make non EC price comparisons dubious.
[15] Suzlon S88 - Hub Height: 80m; Maximum Blade Tip Height: 124m; Swept area: 6250m2
[16] Energy Statistics 2007 www.ens.dk
[17] This would suggest that there are some turbines so badly sited that they will not recover the energy consumed in their construction within their 20 year working lifetime (of course this may be a lot longer than 20 years as they hardly get used). Their carbon footprint rises steeply as their capacity factor falls.
[18] 2xEnercon E-126; 7 MW; 18,000 MWh/yr; rotor diameter 126m; hub height 135m; Rysumer Nacken, Germany.
[19] http://www.suzlon.com/pdf/Capital%20Wind%20Farm%20Flyer.pdf
[20] The Economics of Wind Energy, www.awea.org
[21] Counter intuitively, water vapour reduces air density. The molecular weight of water is 18. As a gas water vapour displaces nitrogen molecules (mw: 28) and oxygen (mw: 32).
[23] Measured under Standard Test Conditions (STC) : irradiance of 1,000 W/m², solar spectrum of Air Mass (AM) 1.5 and module temperature at 25°C
[24] Average pool price in the NEM last year was AUS$42/MWh = 4.2 cents /kWh. The average commercial return to wind farms (after RECs) was around 9 cents /kWh delivered.
[25] 60% sodium nitrate and 40% potassium nitrate, in tanks measuring 14 m in height and 36 m in diameter, each storing 375 MWh – from Wikipedia
[26] Bayswater B Submissions Report - AECOM
[27] For example at a recent workshop of the Australian Academy of Technological Sciences and Engineering (ATSC)
[28] The present ten largest producers of nuclear energy are in order: USA, France, Japan, Russia, Germany, South Korea, Ukraine, Canada, UK and Sweden. Except for Germany and Sweden, all have new nuclear plant under construction or announced. Worldwide there are presently 53 nuclear power stations under construction and another 432 announced or proposed. There are 31 countries with one or more operating nuclear power stations and 9 more with planned stations, including Indonesia.
[29] China has 18 new stations under construction (to raise generating capacity by 70 GWe by 2020); 35 planned; and more than 90 proposed. India has 6 new stations under construction (to raise capacity by 41 GWe by 2020); 23 planned (to raise capacity to 470 GWe by 2050); and 15 proposed.
[30] cf. Australia 246 TWh in 2004
[31] NSW: total thermal capacity (coal & gas) 11,940 MW; all renewable (mainly hydro) 4,600 MW
[32] Financial Times, and AFR, 25 Mar 2010, P63 ‘Nuclear power renaissance in Asia’.
[33] By market size: Japan 58%; Korea 12%; Taiwan 10%; India 6%; China 4%.
[34] Worth over $13billion in exports to NSW in 2009